 Patricia Moore
Your electric meter spinning backward on a sunny afternoon while you’re at work, your solar panels quietly generating more electricity than your empty house can use. That surplus flows to the grid, and your utility company credits your account for every kilowatt-hour. By the time your bill arrives, you owe almost nothing. That’s net metering.
For millions of American homeowners, it’s the single biggest reason their solar investment actually works financially. But here’s the catch: how it works, what it actually pays, and whether you’ll qualify varies enormously depending on where you live and which utility serves your home.
What Net Metering Actually Is (and How the Math Works)
Net metering is a billing arrangement that lets solar homeowners send excess electricity to the grid and receive a credit on their utility bill in return. The word “net” is the key: you’re billed only for the net difference between what you consumed and what you generated.
Here’s the basic math. Say your panels produce 900 kWh in a month and your household uses 700 kWh. You export 200 kWh to the grid. Under full retail net metering, your utility credits those 200 kWh at the same rate you’d pay to buy electricity, typically somewhere between $0.12 and $0.30 per kWh depending on your state. If your rate is $0.15, that’s a $30 credit applied directly to your bill.
Now flip the scenario. In winter, your panels might only produce 400 kWh while you consume 700 kWh. You pull 300 kWh from the grid at retail rate. But that $30 credit from summer rolls forward and offsets part of what you owe.
This credit rollover is where the real annual savings live. In most net metering states, excess credits accumulate month to month and get reconciled once a year. You overproduce in summer, underproduce in winter, and the credits flow like a checking account. A well-sized solar system can reduce a homeowner’s annual electricity bill to nearly zero, or at minimum, a small fixed charge the utility requires regardless.
According to the National Renewable Energy Laboratory (NREL), net metering policies are active in 41 states plus the District of Columbia, though the specific rules, credit rates, and caps differ significantly across those states.
Full Retail Net Metering vs. Reduced-Rate Compensation
| Compensation Type | Credit Rate | Example State/Program | Key Characteristic |
|---|---|---|---|
| Full Retail Net Metering | $0.12-$0.30/kWh | New York, New Jersey, Texas | Exported kWh credited at same rate as imported |
| Avoided Cost / Wholesale | $0.03-$0.06/kWh | Various reformed programs | Credited at utility’s wholesale purchase rate |
| Net Billing | ~$0.05/kWh avg. | California NEM 3.0 (Apr 2023) | Time-of-use import rates; incentivizes battery storage |
Here’s something many installers gloss over: not every state credits your excess solar at the full retail rate, and the difference matters a lot for your payback period.
Full retail net metering is the gold standard. Every kilowatt-hour you export is worth exactly what you’d pay to import one. This is still the policy in states like New York, New Jersey, and Texas (for many utilities). Your exported electricity is treated as if you never sent it out at all.
Avoided cost or wholesale rate compensation is the less favorable version. Some utilities, especially in states that have reformed their net metering programs, only credit you at the wholesale rate, which is roughly what the utility pays to purchase electricity on the open market. That’s often $0.03 to $0.06 per kWh, compared to a retail rate of $0.15 or higher. Your credits shrink dramatically.
Net billing is a middle-ground approach that several states have moved toward. California’s NEM 3.0, which launched in April 2023, is the most talked-about example. Under NEM 3.0, exported solar is credited at an “avoided cost” rate that averages around $0.05 per kWh, but the import rates vary by time of day. The practical effect: California solar owners are now strongly incentivized to add battery storage, shifting their self-consumption rather than exporting surplus power.
Hawaii has gone even further, largely eliminating traditional net metering for new customers and pushing homeowners toward self-supply or smart export programs.
The trajectory matters. States that had generous net metering a decade ago are revising their programs, often reducing compensation rates for new solar customers while grandfathering existing ones for 10 to 20 years.
How Much Can You Actually Save?
Let’s put real numbers on the table. Average U.S. residential electricity consumption is about 10,500 kWh per year, according to the U.S. Energy Information Administration. A properly sized 7 to 9 kW solar system in a mid-Atlantic or southeastern state can produce roughly that much annually, depending on roof angle, shading, and local sun hours.
At an average retail rate of $0.16 per kWh, that’s approximately $1,680 in annual electricity savings if you’re offsetting your entire bill through a combination of direct consumption and net metering credits.
Now stretch that over the 25-year warranted lifespan of a solar panel system, with electricity rates rising at their historical average of about 2.5% per year, and the lifetime savings climb well past $50,000 for many homeowners in states with strong net metering.
In my experience working with homeowners in high-rate states like Massachusetts and Connecticut, where retail electricity can hit $0.22 to $0.28 per kWh, the net metering math is even more compelling. Every kilowatt-hour exported is worth more, so the payback period on a system shrinks noticeably.
The flip side: in a state where your utility only credits exports at $0.04 per kWh, maximizing self-consumption becomes critical. If you’re running a dishwasher and EV charger at noon when your panels are peak-producing, you’re consuming that electricity yourself at full retail value instead of exporting it for pennies.
Step-by-Step: How to Estimate Your Net Metering Savings
You don’t need a solar calculator or a sales pitch to get a ballpark number. Here’s how to do it yourself:
Step 1: Pull 12 months of utility bills. You need your actual monthly kWh consumption, not just the dollar amounts. Most utility portals show this in your account history.
Step 2: Find your state’s net metering policy. The Database of State Incentives for Renewables and Efficiency (DSIRE) at dsireusa.org has up-to-date policy details for every state. Check whether your state offers full retail credits or a reduced rate.
Step 3: Estimate your system’s annual production. NREL’s PVWatts Calculator (free at pvwatts.nrel.gov) lets you enter your address, system size, and roof angle to get a monthly production estimate. Use a 7 kW system as a baseline if you’re not sure what size you’d install.
Step 4: Calculate monthly net consumption. Subtract estimated production from actual consumption each month. Positive months mean you’re pulling from the grid. Negative months mean you’re exporting.
Step 5: Apply credit values. Multiply your export months by the applicable credit rate (retail or avoided cost). Multiply your import months by your retail rate. The annual difference compared to paying full retail for everything is your net metering savings estimate.
Step 6: Factor in your fixed utility charges. Most utilities charge a base customer fee of $5 to $20 per month regardless of consumption. This portion of your bill won’t go away with solar, so subtract it from your total savings.
A good home energy monitor can make this process much more precise by breaking down your consumption hour by hour. The Emporia Vue Energy Monitor installs in your breaker panel and shows real-time generation and consumption data, which helps you align your usage with peak solar production.
Disclosure: As an Amazon Associate, we earn a small commission from qualifying purchases at no extra cost to you.
Net Metering and Battery Storage: How They Interact
Adding a battery like the Tesla Powerwall or Enphase IQ Battery changes the net metering calculus in a meaningful way.
In states with full retail net metering, a battery often adds cost without proportionally adding savings. If you’re already getting dollar-for-dollar credit for everything you export, there’s less financial incentive to store that power instead. The battery earns its keep primarily through backup power during outages.
In states with reduced-rate exports, batteries become much more financially attractive. Under California’s NEM 3.0, for example, storing your midday surplus and using it during the evening peak hours, when import rates can hit $0.45 to $0.55 per kWh under time-of-use pricing, is dramatically more valuable than exporting it for a $0.05 credit.
The U.S. Department of Energy notes that pairing storage with solar is increasingly important as utilities move toward time-of-use rates, which price electricity differently depending on when you use it, rather than flat per-kWh rates.
The Fine Print That Can Hurt Your Savings
A few policy details that don’t get enough attention:
Annual true-up vs. monthly rollover. Some utilities reset unused credits to zero at year-end rather than paying them out. If you’ve accumulated significant credits, they may just disappear. Always ask your utility how end-of-year excess credits are handled.
System size caps. Many states limit the system size eligible for net metering to 100% to 120% of your annual consumption. Oversizing your system beyond your actual usage won’t generate proportionally more credits, it’ll just generate orphaned power you can’t monetize.
Standby charges and demand charges. A small but growing number of utilities have introduced fixed monthly charges specifically for solar customers, or “demand charges” based on peak draw from the grid rather than total consumption. These can quietly erode your savings without changing the advertised net metering rate.
Grandfathering windows. If your state is in the process of reforming its net metering program, there’s often a window during which new customers can lock in the old, more favorable rate for 10 to 20 years. Waiting could mean accepting a significantly less generous policy for the lifetime of your system.
Net metering is genuinely one of the most powerful financial tools available to solar homeowners, but it’s not a universal guarantee. The details of your state’s policy, your utility’s specific rules, and how well your system is sized all determine whether you’re looking at a $200 annual bill or a $1,800 one. Get those details right before you sign anything, and the math can be very compelling.
Sources
- the National Renewable Energy Laboratory (NREL)
- Emporia Vue Energy Monitor
- The U.S. Department of Energy
- Renogy 200W Solar Starter Kit + 30A Charge Controller
- EF EcoFlow DELTA 2 Portable Power Station (1024Wh)
Disclosure: As an Amazon Associate, we earn a small commission from qualifying purchases at no extra cost to you. We only recommend products that genuinely support the topics covered in this article.
- Renogy 200W Solar Starter Kit + 30A Charge Controller (~$169), Complete beginner solar kit, 200W monocrystalline panel, charge controller, and mounting hardware included.
- EF EcoFlow DELTA 2 Portable Power Station (1024Wh) (~$599), 1024Wh LFP battery with 1800W output, top-rated solar generator for home backup power. Charges in under 2 hours.
- Renogy 2×100W Monocrystalline Solar Panels (~$99), Expandable 200W panel set from the most trusted DIY solar brand, used widely in off-grid and home backup systems.
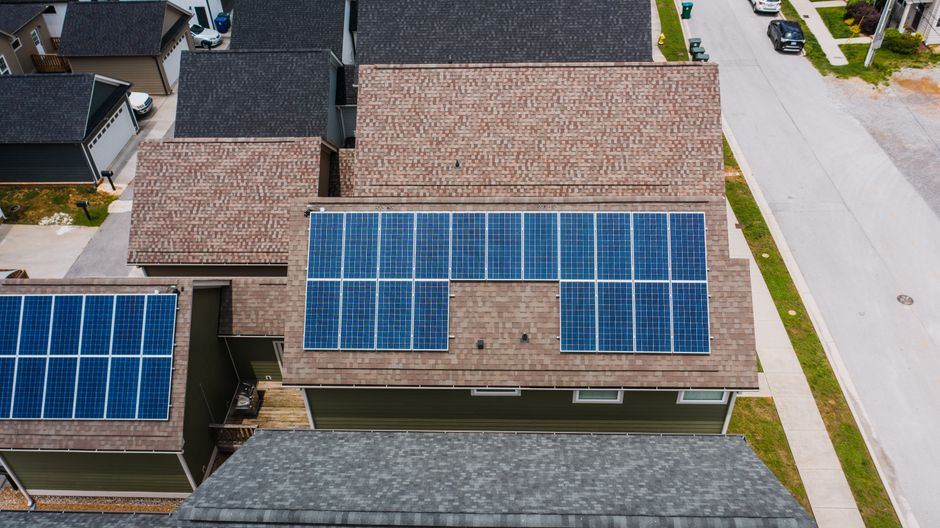
Photo: RDNE Stock project via Pexels
Recommended Resources
Disclosure: As an Amazon Associate, we earn a small commission from qualifying purchases at no extra cost to you. We only recommend products that genuinely support the topics covered in this article.
- Renogy 200W Solar Starter Kit + 30A Charge Controller (~$169), Complete beginner solar kit, 200W monocrystalline panel, charge controller, and mounting hardware included.
- EF EcoFlow DELTA 2 Portable Power Station (1024Wh) (~$599), 1024Wh LFP battery with 1800W output, top-rated solar generator for home backup power. Charges in under 2 hours.
- Renogy 2×100W Monocrystalline Solar Panels (~$99), Expandable 200W panel set from the most trusted DIY solar brand, used widely in off-grid and home backup systems.