 Nadia Patel
Your neighbor’s $14 electricity bill versus your $220 one. That’s the question that kicks off most solar conversations, and it’s the right one to ask, just not always in the way people ask it. The honest answer depends on numbers most solar salespeople won’t sit down and walk through carefully. So let’s actually do that.
What Solar Actually Costs in 2024
A typical residential solar installation runs $17,000 to $28,000 before incentives. That’s for an 8 kilowatt (kW) system, which breaks down to roughly $2.75 to $3.00 per watt installed. Once you account for the federal Investment Tax Credit (ITC) covering 30% of the cost, that $23,000 system drops to about $16,100 out of pocket. Some states add their own credits on top.
Several things move the price up or down:
- System size: Bigger home, bigger electricity bills, bigger system. A 5 kW system might work for a condo; a 12 kW system barely covers a 3,500-square-foot home with a pool.
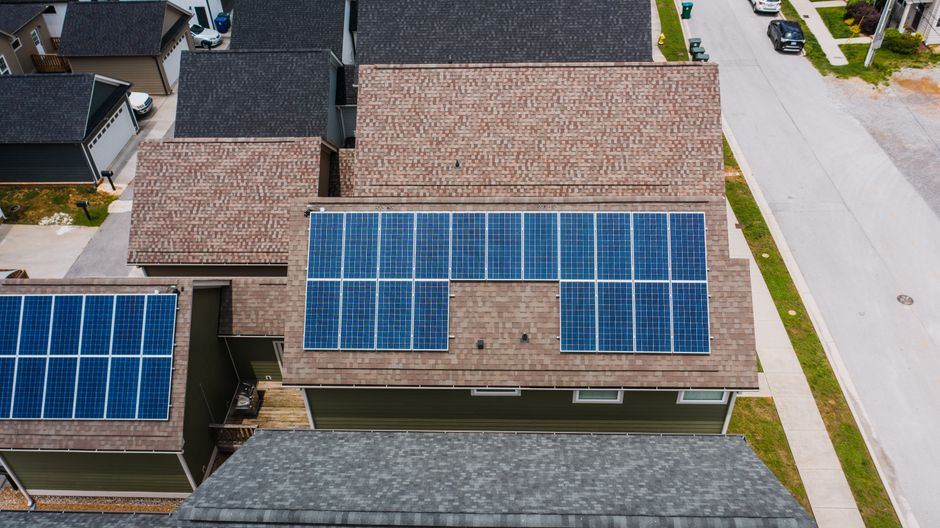
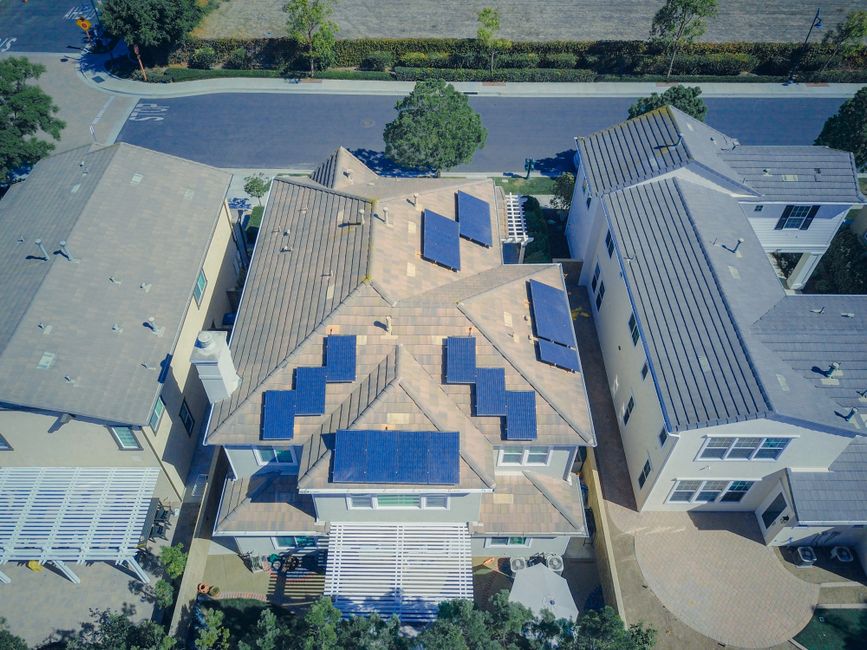
- Roof complexity: Simple gabled roofs are cheaper to install than hip roofs with multiple angles and obstructions.
- Panel quality: Budget panels from lesser-known brands cost less but degrade faster. SunPower or Panasonic panels carry higher price tags but better degradation warranties.
- Battery storage: A Tesla Powerwall or similar adds $10,000 to $15,000. It’s optional, but more people add it as grid outages tick up.
Never accept a “ballpark” quote without someone looking at your actual roof and actual utility bills. I’ve seen quotes for the same house vary by $8,000 depending on the installer. Get three quotes minimum.
How Much Can Solar Actually Save You?
Helpful resource: Emporia Smart Outlet with Energy Monitoring is a top-rated option for this. (As an Amazon Associate this site earns from qualifying purchases.)
Your savings come down to three variables: how much electricity you actually use, what your utility charges per kilowatt-hour (kWh), and how much sun your roof gets.
The national average hit 16.2 cents per kWh in 2023, but that number means almost nothing on its own. California residents pay 30 to 35 cents per kWh under PG&E’s tiered rates. Louisiana customers might pay 11 cents. That difference more than doubles potential savings.
Take a household using 900 kWh per month at 16 cents per kWh. That’s about $1,728 per year on electricity. A properly sized system covering 90% of that usage saves roughly $1,555 annually. Payback on a $16,100 post-credit system comes to about 10.3 years. With 25-year panel warranties, you’d get over 14 years of essentially free electricity after breakeven.
In high-rate states, the numbers look much better. That same setup in California at 32 cents per kWh produces savings closer to $3,100 per year, cutting payback to around 5 years. That’s genuinely good.
Here’s what installers often bury: net metering policies vary massively. Net metering lets you send excess solar power back to the grid for credit. Some utilities offer full retail rate credits. Others, like utilities in Nevada and Hawaii after recent policy changes, pay well below retail. If your utility pays you 4 cents per kWh for power you send back but charges 30 cents to buy it back at night, oversizing your system stops making sense.
The Payback Period: What’s Realistic?
| Scenario | System Cost (After ITC) | Annual Savings | Payback Period |
|---|---|---|---|
| High-rate state (CA, 32¢/kWh) | $16,100 | ~$3,100 | ~5 years |
| Average U.S. rate (16¢/kWh) | $16,100 | ~$1,550 | ~10 years |
| Low-rate state (LA, 11¢/kWh) | $16,100 | ~$1,065 | ~15 years |
| High-rate + poor sun (Pacific NW) | $16,100 | ~$1,800 | ~9 years |
You deserve honest benchmarks, not the optimistic projections on a solar company’s brochure.
The National Renewable Energy Laboratory (NREL) shows average payback periods for residential solar ranging from 6 to 12 years depending on local rates and sun availability. That range matches what I see in practice.
| Scenario | System Cost (After ITC) | Annual Savings | Payback Period |
|---|---|---|---|
| High-rate state (CA, 32¢/kWh) | $16,100 | ~$3,100 | ~5 years |
| Average U.S. rate (16¢/kWh) | $16,100 | ~$1,550 | ~10 years |
| Low-rate state (LA, 11¢/kWh) | $16,100 | ~$1,065 | ~15 years |
| High-rate + poor sun (Pacific NW) | $16,100 | ~$1,800 | ~9 years |
That low-rate scenario deserves hard scrutiny. If you’re in a state with cheap electricity and mediocre sun, solar’s financial case weakens significantly. A 15-year payback on a 25-year system technically works, but you’re absorbing weather risk, equipment risk, and the possibility of policy shifts over that entire window. I’ve advised clients in some Southeastern states to wait until rates climb or battery economics improve.
One thing that consistently gets underestimated: electricity rates rise. Historically they’ve climbed about 2-3% per year. Every year your utility charges more, your solar savings grow larger. A system saving $1,500 in year one might save $2,100 in year 15. That makes the payback period look a lot better in hindsight.
Step-by-Step: How to Calculate Your Own Solar ROI
You don’t need a sales appointment to run your own numbers. This takes about 20 minutes.
Step 1: Pull your last 12 months of electricity bills. You need total kWh used, not just dollar amounts. Most utilities show this in their online account portal. Add up all 12 months for annual usage.
Step 2: Find your average rate. Divide your total annual electricity cost by your total annual kWh. This gives you your blended rate, which accounts for tiered pricing and fees better than the advertised “base rate.”
Step 3: Estimate your system size. Divide your annual kWh by 1,200. That’s a rough rule of thumb based on average U.S. sun hours. A home using 10,800 kWh per year needs about 9 kW. NREL’s free PVWatts calculator gives more precision based on your ZIP code.
Step 4: Estimate installed cost. Multiply your system size in kW by $2.75 for a baseline. Subtract 30% for the federal tax credit. You need enough tax liability to claim the full credit in the installation year, or you can spread it across future years.
Step 5: Estimate annual savings. Multiply your system’s estimated annual production (from PVWatts) by your blended rate per kWh. That’s your gross savings before loan interest.
Step 6: Calculate payback. Divide your net out-of-pocket cost by annual savings. Simple payback period.
Once your system is installed, track production with a home energy monitor like the Emporia Vue Energy Monitor (Amazon affiliate link, we may earn a commission). You see real-time solar production and home consumption in one app. It’s one of the best $150 purchases my clients make alongside their panels.
Hidden Costs and Honest Downsides
Savings aren’t the whole story. There are real costs and risks.
Inverter replacement: Most string inverters last 10 to 15 years. Your panels carry a 25-year warranty, but you’ll likely replace the inverter once during that period. Cost runs $1,000 to $3,000. Microinverters like Enphase typically last longer but cost more upfront.
Roof condition: If your roof is 15 years old, replace it before installing solar. Removing and reinstalling panels for a new roof costs $1,500 to $3,000 extra. Many installers will claim the roof “looks fine.” Get a roofer’s independent assessment.
HOA and permitting delays: Some HOAs still fight solar installations. Permitting can take two weeks in solar-friendly areas or four months elsewhere. Factor this in if you’re chasing a tax year deadline.
Financing costs: Solar loans often run 5 to 9%. A $23,000 system financed at 7% over 20 years costs about $43,000 total with interest. You still save money versus the utility, just not as much as the brochure claims. Always calculate total financing costs before signing.
Shading: Even partial shade cuts production significantly. A chimney, a tree, a neighbor’s roof. If more than 20% of your roof area is shaded during peak sun hours, your economics change. Tools like Aurora Solar and SolarEdge’s Proposal Tool can model this. Good installers use them before quoting.
When Solar Genuinely Doesn’t Make Sense
Some homeowners should honestly skip or delay solar. If you’re selling in two to three years and financing with a solar loan, transferring that loan complicates things. Leased systems are messier for home sales. Cash buyers are rarer than you’d think, and not every buyer accepts solar debt.
Electricity rates below 10 cents per kWh make payback genuinely difficult. Not impossible, but you need clear eyes going in. If your roof faces predominantly north or northwest, production drops sharply. Energy efficiency upgrades might serve you better first.
And if your utility switched to “net billing” that pays wholesale rates instead of retail net metering, oversizing your system wastes money. Right-sizing to your actual consumption, not theoretical maximum, becomes critical.
The solar decision isn’t whether panels are “worth it” in some abstract sense. It’s whether they’re worth it for your specific roof, your specific utility, and your specific finances. Run your own numbers, get multiple quotes, check your utility’s net metering policy. Don’t let anyone rush you. A system you understand beats one you were sold.
Sources
- Emporia Smart Outlet with Energy Monitoring
- The National Renewable Energy Laboratory (NREL)
- Emporia Vue Energy Monitor
- Renogy 100W 12V Flexible Solar Panel
- P3 Kill A Watt Electricity Usage Monitor
Disclosure: As an Amazon Associate, we earn a small commission from qualifying purchases at no extra cost to you. We only recommend products that genuinely support the topics covered in this article.
- Renogy 200W Solar Starter Kit + 30A Charge Controller (~$169), Complete beginner solar kit, 200W monocrystalline panel, charge controller, and mounting hardware included.
- EF EcoFlow DELTA 2 Portable Power Station (1024Wh) (~$599), 1024Wh LFP battery with 1800W output, top-rated solar generator for home backup power. Charges in under 2 hours.
- Renogy 2×100W Monocrystalline Solar Panels (~$99), Expandable 200W panel set from the most trusted DIY solar brand, used widely in off-grid and home backup systems.
Recommended Resources
Disclosure: As an Amazon Associate, we earn a small commission from qualifying purchases at no extra cost to you. We only recommend products that genuinely support the topics covered in this article.
- Renogy 200W Solar Starter Kit + 30A Charge Controller (~$169), Complete beginner solar kit, 200W monocrystalline panel, charge controller, and mounting hardware included.
- EF EcoFlow DELTA 2 Portable Power Station (1024Wh) (~$599), 1024Wh LFP battery with 1800W output, top-rated solar generator for home backup power. Charges in under 2 hours.
- Renogy 2×100W Monocrystalline Solar Panels (~$99), Expandable 200W panel set from the most trusted DIY solar brand, used widely in off-grid and home backup systems.