 Patricia Moore
A 2,000 square foot home is almost exactly the national average for solar quotes I see come across my desk. Which means I’ve had this particular conversation more times than I can count.
You’re probably at the “just trying to figure out the ballpark” stage. Maybe you got a mailer, or your neighbor just had panels installed, or your electricity bill crossed some threshold that made you actually pay attention. Whatever got you here, I want to give you honest numbers, not a sales pitch.
So let’s talk real costs.
What a 2,000 Sq Ft Home Actually Needs (and What It’ll Cost)
| System Size | Monthly Usage | Gross Cost | Federal Credit (30%) | Net Cost | Payback Period |
|---|---|---|---|---|---|
| 6.5 kW | 780 kWh | $18,100 | $5,430 | $12,670 | ~10-12 years |
| 8.0 kW | 1,050 kWh | $24,000 | $7,200 | $16,800 | ~8-9 years |
| 8.5 kW | 1,050 kWh | $25,500 | $7,650 | $17,850 | ~8-9 years |
Here’s the thing most installers won’t tell you upfront: square footage isn’t what determines system size. Your electricity consumption does.
A 2,000 sq ft home in Phoenix uses a completely different amount of electricity than a 2,000 sq ft home in Portland. Climate, insulation quality, number of people living there, whether you have an EV, whether you’re running a home office with multiple screens all day, all of it matters more than your floor plan. I’ve seen 1,800 sq ft homes needing 10 kW systems and 2,100 sq ft homes that only needed 7 kW because the homeowners were just more efficient.
That said, you need a starting point. Across the projects I’ve worked through, a 2,000 sq ft home in a temperate U.S. climate typically uses somewhere between 900 and 1,200 kWh per month. That usually translates to a solar system in the 7 to 10 kilowatt range.
As of June 2026, the national average installed cost for residential solar runs about $2.80 to $3.20 per watt before incentives, according to data tracked by the Solar Energy Industries Association (SEIA). On a 8 kW system (a reasonable midpoint for this home size), that puts you at roughly $22,400 to $25,600 gross before any tax credits.
Then the federal tax credit comes in.
The Residential Clean Energy Credit currently sits at 30% of the total installed cost. On that $24,000 midpoint, that’s $7,200 back on your federal taxes. Net cost: around $16,800. Some states layer additional rebates on top, Massachusetts, New York, and Minnesota have been particularly generous, so your actual out-of-pocket could come down further.
A worked example that’s pretty typical:
A homeowner in suburban Atlanta, 2,100 sq ft, using about 1,050 kWh/month → Quoted an 8.5 kW system at $25,500 gross → After 30% federal credit ($7,650), net cost of $17,850. Georgia Power net metering at the time added an estimated $90-120/month in bill offset, giving them a payback period of around 8-9 years.
Not spectacular, but not bad either. Especially with panels carrying 25-year production warranties.
Why Your Number Could Be Higher (or Lower) Than Average
Helpful resource: Lutron Caséta Wireless Smart Dimmer Kit is a top-rated option for this. (As an Amazon Associate this site earns from qualifying purchases.)
I want to be direct about the ranges here because they’re genuinely wide, and I’ve seen homeowners get burned by anchoring on the low end.
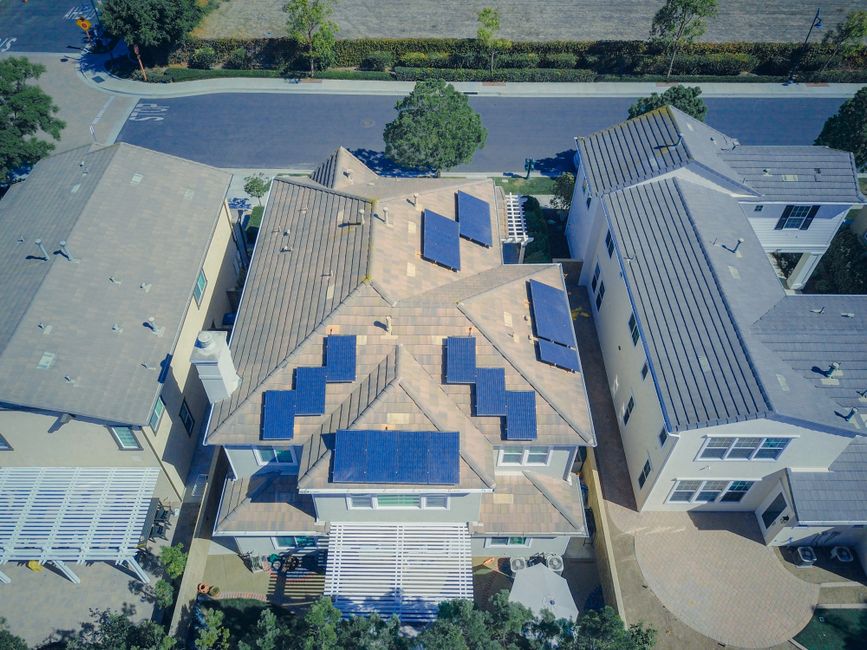
Roof complexity matters a lot. A single-plane south-facing roof with no shading? Easy, cheaper installation. Multiple dormers, steep pitch, tile roofing that requires special mounting hardware, mature trees shading the afternoon sun? Your cost per watt climbs. I’ve seen simple installs come in at $2.60/watt and complex ones hit $3.80/watt on the same size system just based on roof work alone.
Panel brand and type. Standard monocrystalline panels from Jinko Solar or LONGi (reliable workhorses, both) cost less than premium panels like SunPower Maxeon or REC Alpha. The premium panels are genuinely better, higher efficiency means you need fewer of them, which helps on smaller or shaded roofs. But on a clear, open roof with plenty of space, spending an extra $3,000-4,000 for premium efficiency panels rarely pencils out. Honestly, I’d skip the premium unless you have roof space constraints.
Inverter choice. String inverters (one central unit) are the cheapest option. Microinverters from Enphase or power optimizers from SolarEdge cost more upfront but give you panel-level performance data and better output in partial shade. For a home with any shading at all, the upgrade is usually worth it. If you want to monitor your system’s performance closely, a home energy monitor like the Emporia Vue (affiliate link) pairs well with most modern systems and makes it easy to see exactly what’s happening.
Labor costs by region. Installation labor in the Northeast runs 20-30% higher than in the Southeast or Midwest. That’s just the reality of regional labor markets.
A second worked example, from the other direction:
A reader named Carolyn emailed me last fall about her quote in rural Tennessee. 2,000 sq ft, simple gable roof, full southern exposure, no trees, modest electricity use (about 780 kWh/month) → Installer recommended a 6.5 kW system → Gross cost $18,100, net after federal credit $12,670. She added a small battery (LG RESU 10H) for backup, which added $8,000. Total with storage: ~$20,670. Still a reasonable investment given her area’s occasional grid outages.
The Battery Question
how to size a solar power system for your home · AMJ Engineering on YouTube
You’re probably wondering about batteries by now. I always get this question.
Adding a battery storage system, like the Tesla Powerwall 3 or the Enphase IQ Battery 5P, typically adds $8,000 to $15,000 to your project, depending on how much storage capacity you want. One Powerwall 3 is around $11,500 installed as of this year.
Here’s my honest take: batteries don’t improve your financial return in most cases. If you’re grid-tied with decent net metering, the math rarely works out. The payback period extends significantly. What batteries do provide is resilience, keeping your lights on during outages. If that’s a priority (and in some regions, with increasingly unreliable grid weather events, it genuinely is), then go for it. Just go in knowing you’re paying for security, not strictly for savings.
What Goes Wrong With Solar Estimates
I used to think payback calculations were straightforward until I started comparing the estimates installers gave clients with what actually happened three to five years later. The gap is sometimes uncomfortable.
The most common mistake is installer projections that assume electricity rates rise at 3-4% per year. Sometimes they do. Sometimes they don’t. NREL’s own modeling shows that rate escalation assumptions are one of the biggest variables in lifetime savings projections, and small differences compound dramatically over 25 years. An installer who projects 4% annual rate increases is going to show you a much rosier return than one who uses 2%. Always ask what rate escalation assumption is baked into the savings estimate.
Second most common mistake: overestimating production. Ask for the system’s production estimate in kWh per year, then check it independently using NREL’s free PVWatts calculator (it takes about five minutes). I’ve seen installer proposals that are 15-20% optimistic on production. That’s not always intentional, shading analysis done from satellite imagery isn’t always accurate, but it skews every number downstream.
A quick worked example to show why this matters:
System quote assumes 11,500 kWh/year production, saving homeowner $1,840/year at $0.16/kWh → Real production (after accounting for tree shading) comes in at 9,200 kWh/year → Actual savings: $1,472/year → Payback period extends from 9 years to 11+ years. Not a disaster, but not what they were sold.
Sources
- Solar Energy Industries Association (SEIA): Residential solar market data, installed cost benchmarks, and federal incentive tracking
- National Renewable Energy Laboratory (NREL) PVWatts Calculator: Free tool for estimating solar production by location and system size
- EnergySage Solar Marketplace: Aggregated real-world solar quote data and consumer cost comparisons
- Lawrence Berkeley National Laboratory, “Tracking the Sun” report: Annual analysis of installed solar prices across U.S. residential projects
- U.S. Department of Energy, Residential Clean Energy Credit guidance: Current federal tax credit details and eligibility requirements
Recommended Resources
Disclosure: As an Amazon Associate, we earn a small commission from qualifying purchases at no extra cost to you. We only recommend products that genuinely support the topics covered in this article.
- Renogy 200W Solar Starter Kit + 30A Charge Controller (~$169), Complete beginner solar kit, 200W monocrystalline panel, charge controller, and mounting hardware included.
- EF EcoFlow DELTA 2 Portable Power Station (1024Wh) (~$599), 1024Wh LFP battery with 1800W output, top-rated solar generator for home backup power. Charges in under 2 hours.
- Renogy 2×100W Monocrystalline Solar Panels (~$99), Expandable 200W panel set from the most trusted DIY solar brand, used widely in off-grid and home backup systems.